Web Chat Widget Changes, Tested Properly: Change One Setting, Compare Two Periods and Know If It Really Worked (Free Before/After Calculator)
Web chat widget settings are easy to change and hard to judge. You rewrite the welcome text, chats go up for a week, and you call it a win, until the next week they drop again. This guide gives you a simple way to test one change at a time: pick the setting, measure chats and leads per 100 visitors for two equal periods, and check whether the difference is bigger than normal week-to-week noise. A free calculator does the maths and tells you how much traffic you’d need to be sure.
⚡ In short
- Don’t compare raw chat counts. Compare chats per 100 visitors, so a busy week doesn’t look like a better widget.
- Change one setting, keep everything else still, and run two periods of the same length covering the same weekdays.
- Small sites see big random swings. Check the difference with the calculator before you believe it.
- Watch leads too. A change that adds chats but no leads may only be adding noise for your team.
Why guessing fails
Your chat numbers bounce around even when nothing changes
Every small business owner who has looked at chat numbers knows the feeling. Monday is busy, Tuesday is dead, last week had twice as many chats as this week, and you didn’t touch a thing.
That bouncing is normal. With a few hundred visitors a week, a handful of chats either way is just chance: one person who happened to have a question, one group of visitors from a WhatsApp forward, one quiet afternoon. On top of that, real causes come and go: a festival sale, a newspaper mention, an ad you paused, school holidays.
Now imagine you change the welcome message on a Thursday. The next week happens to be busier. Chats go up. It looks like the new message works, so you keep it and move on to the next idea. Three changes later, you have no idea which ones helped, which made no difference, and which quietly made things worse.
The fix isn’t complicated statistics. It’s three habits:
- Use rates, not counts. Chats per 100 visitors stays comparable when traffic changes.
- Change one thing at a time. Otherwise you can’t tell which change did the work.
- Ask whether the difference is bigger than the usual noise. That’s the one bit of maths, and the calculator below does it for you.
This is a simple before-and-after test, not a split test where two versions run side by side. It’s less precise, because something else might change between the two periods. But it needs no extra software, works with the counts you already have, and is far better than going on feel.
What to test
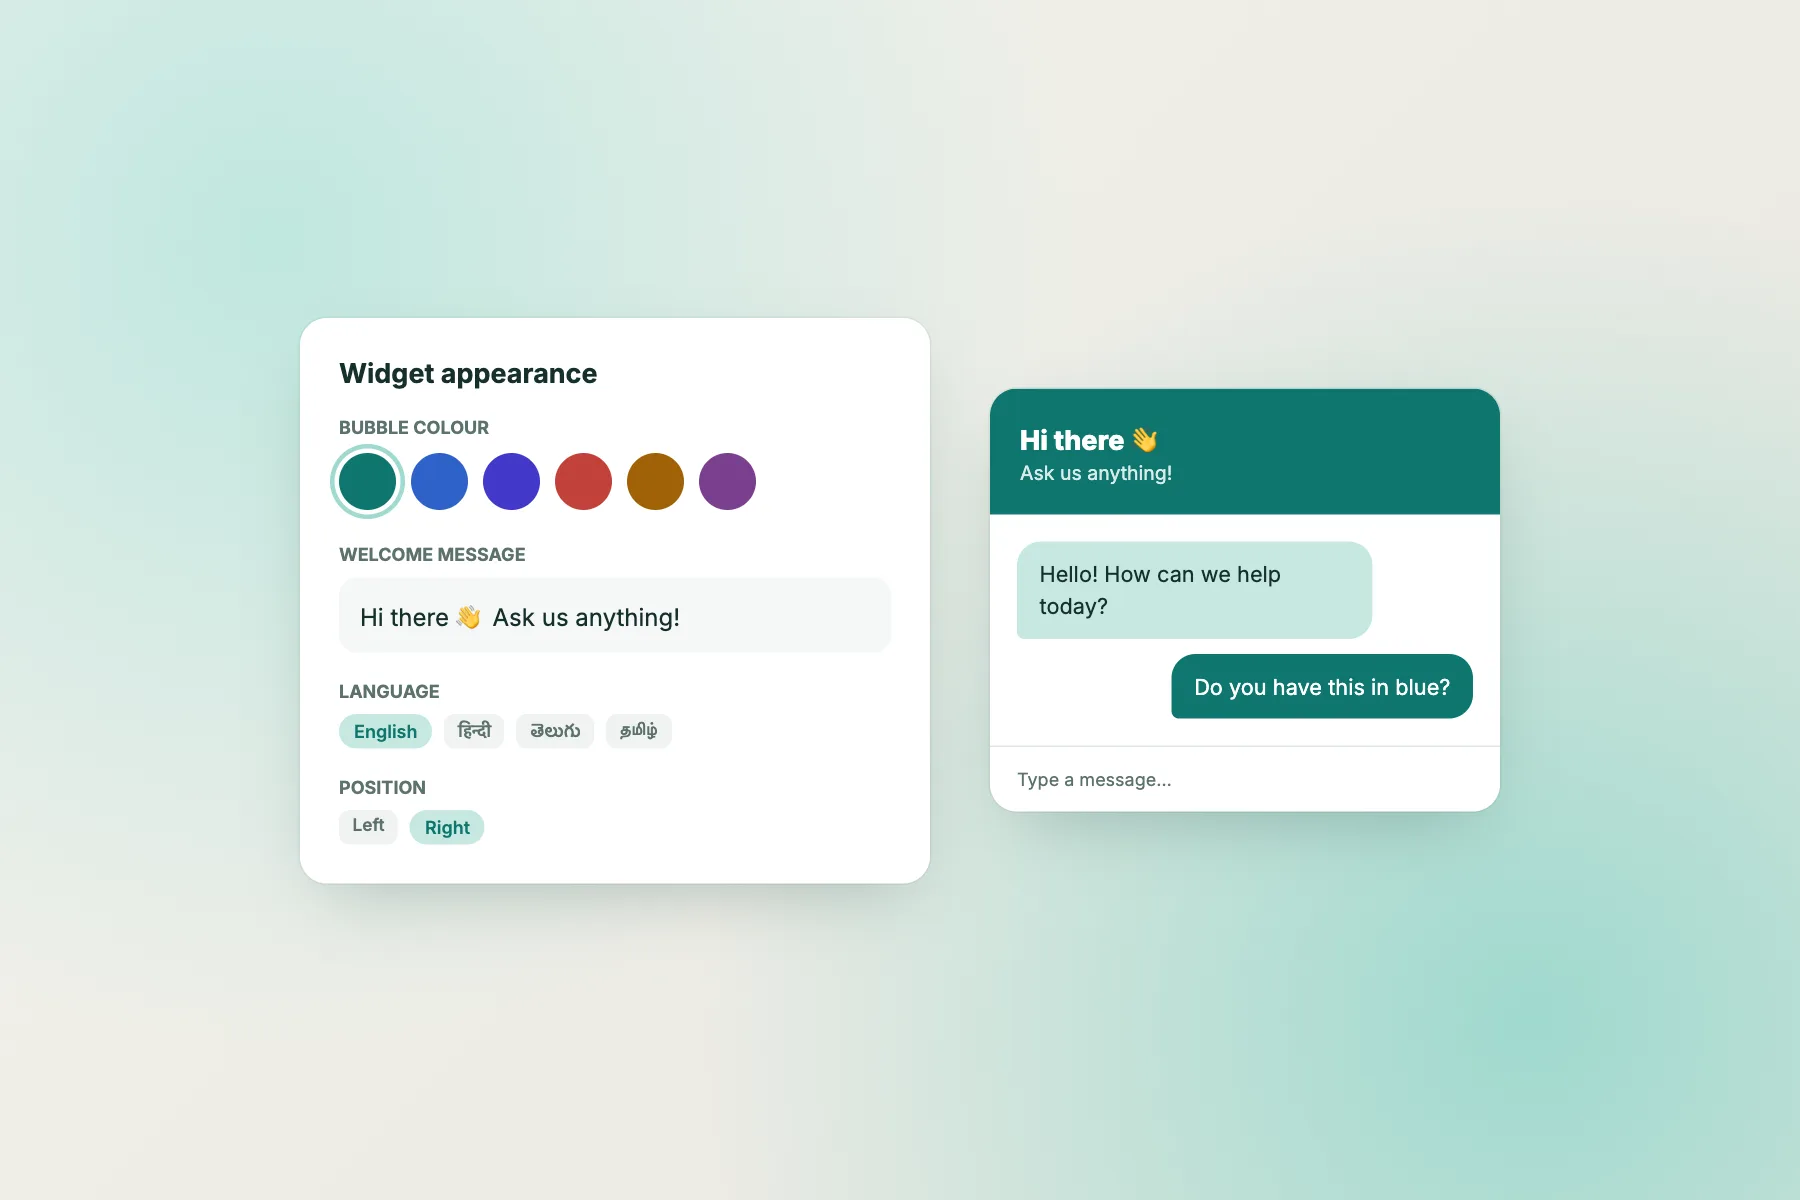
Eight web chat widget settings worth testing one by one
Each is a single change in your LiveChatBot widget or Flows. Start with the ones visitors see first.
Welcome text
The first line in the open chat. Try a specific question (“Need help choosing a size?”) against a general greeting.
Attention grabber card
The small card beside the bubble. Test having one against none, or two different messages.
Position
Bottom right against bottom left, especially if the bubble covers a cart or WhatsApp button on phones.
Team name and avatar
A real first name and photo against your brand name and logo.
Proactive message timing
A Flow that greets visitors after 20 seconds against one that waits 45, on the same pages.
Widget cards
Adding a WhatsApp, call or link card, and whether it pulls chats away or adds contacts.
Where it shows
Hiding the widget on checkout or blog pages, and the effect on chats that matter.
Colour
Your brand colour against a contrasting one that stands out from the page.
The method
How to run a fair before-and-after test
Pick one change and write it down
Write the exact before and after, for example: “Welcome text: ‘Hi! How can we help?’ → ‘Questions about delivery or sizes? Ask here.’” Keep a simple log with the date of every change. Months later, it’s the only reliable record of what you tried.
Choose your period length
Use whole weeks, so both periods include the same weekdays. One week each is the minimum; two weeks each is better for most small sites. If you get fewer than 15 chats a week, plan on three or four weeks per period.
Freeze everything else
During both periods, don’t change other widget settings, Flows, opening hours or pages where the chat shows. Note anything you can’t control, such as a sale, a holiday or an ad campaign starting.
Collect three numbers per period
– Visitors: from your analytics or your chat dashboard’s visitor tracking, counted the same way both times. – Chats started: conversations where the visitor actually wrote something. – Leads: chats where the visitor left an email or phone number, whether in the chat or through the away form.
Compare the rates, then check the noise
Put the six numbers into the calculator. It shows each rate per 100 visitors, the percentage change, and whether the difference is likely real, promising or could easily be chance. If it’s not clear yet, it tells you roughly how many visitors you’d need to settle it.
Decide, log, move on
Keep a change that’s likely real and positive. Undo one that’s likely real and negative. For “could be chance”, keep whichever version you prefer and test something with a bigger expected effect next.
Free tool
Before/after calculator for your web chat widget
Enter visitors, chats and leads for two equal periods. The tool works out the rates, the change, and whether it’s bigger than normal week-to-week noise.
Enter the same counts for two periods of equal length: before the change (A) and after it (B). Leads = chats where the visitor left an email or phone number.
Runs only in your browser; nothing is sent or saved. Uses a standard two-proportion test; it can’t account for sales, ads or holidays that happened in one period only.
Reading the result
What 'likely real' and 'could be chance' actually mean
The calculator runs a standard two-proportion test, the same one used for website split tests. You don't need to understand the formula, but it helps to know what the answer means.
Likely a real change means a difference this big would rarely appear if the setting had made no difference at all. It doesn't prove your change caused it. A sale or an ad in one period can do the same thing, which is why you note those.
Promising, not proven means the numbers lean one way but not strongly. Run another period of the same length with the new setting and enter the combined totals.
Could easily be chance is the most common verdict on small sites, and it's useful. It tells you to stop reading meaning into small swings. The tool also shows how many visitors per period you'd need to confirm a change of the size you saw. If that number is far more than you get in a month, the change is too small to measure on your site, and your time is better spent on a bigger idea.
The example in the tool, explained
Load the example to see an illustrative shop. Period A had 2,400 visitors and 36 chats: 1.5 chats per 100 visitors. After a new welcome text, period B had 2,300 visitors and 58 chats: about 2.5 per 100. That jump is large enough to be likely real.
Leads tell a different story. They went from 9 to 15, which looks like a big rise, but at this size it could easily be chance. The honest conclusion: the new text gets more people talking; whether it gets more contacts needs more time. That's the kind of answer that stops you over-claiming a win.
Worked example
One illustrative shop, three tests in six weeks
Made-up numbers to show how a test log reads. Your rates will be different.
| Test | Before (per 100 visitors) | After (per 100 visitors) | Verdict | Decision |
|---|---|---|---|---|
| Welcome text: general → specific question | 1.5 chats | 2.5 chats | Likely real | Keep the specific question |
| Grabber card: none → "Delivery to your pin code? Ask us" | 2.5 chats | 2.8 chats | Could be chance | Keep it (owner likes it), test something bigger |
| Hide widget on checkout | 0.6 leads | 0.7 leads | Could be chance | Keep hidden, fewer distractions at payment |
Beyond the chat rate
Count what matters to your team, not only what goes up
More chats isn't automatically better. A proactive message that pops up after five seconds on every page can double your chat rate with people saying "hi" and leaving. Your team does more work, and nothing improves.
So for each test, look at a second number that reflects value:
- Leads per 100 visitors, if you sell services or high-value products.
- Chats your team marked as solved, or tickets created, if support is the goal.
- Chats that got no reply, which can rise if a change brings in more than your team can handle.
- Orders from chatting visitors, if you can match them, for shops.
A good result is one where the useful number goes up or holds steady while the chat rate rises. A bad one is where chats rise and the useful number falls, or your missed chats grow. If your team is small, read our workload estimator before testing anything that will increase chat volume. For ideas on what to write, our welcome message guide and proactive chat guide are good starting points, and the widget settings guide explains what each option does.
Six-week plan
A testing calendar for a small site
Change nothing. Record visitors, chats and leads. This is period A for your first test.
Change only the welcome text. Compare with weeks 1–2.
Keep the winner from test 1. Change one more thing. Compare with weeks 3–4.
Date, setting, before, after, anything unusual that happened.
Common mistakes
Six ways widget tests mislead you
Comparing a sale week with a normal week. Big events swamp small changes. If one period had a sale, either wait or note it next to the result.
Testing for three days. Short periods catch different weekdays and too few chats. Use whole weeks.
Changing two things at once. You'll know something worked, but not what. If you must change several things, treat it as one bundle and don't try to credit any single part.
Counting greetings as chats. If the proactive message counts as a chat whether or not the visitor replies, your rate rises for nothing. Count only chats where the visitor wrote.
Stopping the moment it looks good. Checking every day and stopping on a good day guarantees false wins. Decide the period length first and stick to it.
Forgetting phones. Many small sites get most visitors on phones. A position or card change can look great on a laptop and cover the "Add to cart" button on a phone. Check both before and after. Our corner planner helps with crowded screens.
A web chat widget that's been tested one change at a time ends up quietly better than one that's been redesigned on instinct every month, and you'll know why it works.
Frequently asked questions
How long should I run each period when testing a web chat widget change?
At least one full week each, and two weeks on most small sites. If you get fewer than 15 chats a week, use three or four weeks per period so the totals are big enough to read.
Can I run two versions at the same time?
LiveChatBot doesn't split visitors between two widget versions, so this guide uses a before-and-after comparison. You can still compare two Flows aimed at different pages, as long as you remember the pages differ too.
Where do the visitor numbers come from?
Your website analytics or your chat dashboard's visitor tracking. Use the same source for both periods, because different tools count visitors differently.
What if the result says 'could easily be chance'?
Keep whichever version you prefer, and test a change you expect to have a bigger effect. The tool shows how much traffic you'd need to confirm the change you saw.
Does the calculator send my numbers anywhere?
No. It runs entirely in your browser and nothing is sent or saved.
Keep reading
Related guides
Web Chat Applications on the Team Side: Answer Chats From a Browser Tab Without Missing Alerts (Free Alert Checker)
Web Chatroom Safety for Members and Moderators: Room Rules, Scam Patterns and a Free Oversharing Screener
Website Bot Visitors: How to Spot Crawlers, AI Scrapers and Spam Bots in Your Traffic and Chat
Test your widget one change at a time
Welcome text, grabber card, cards, position and Flows are all free to change in LiveChatBot. Start free on livechatbot.in.